Can an Essay have Charts? How to Insert Graphs and Pictures
Writing convincing essays is key to pass your class well and score high grades. One of the ways to convince your professor is to include graphs, screenshots, and pictures. In this informative piece, I will explain if an essay can have charts, graphs or graphics, and how to do that effectively.
After you read through it, you will get great tips to make your essay convincing. However, if you have no time to do that, you can hire essay writers to complete your essays and get that grade. But read on to handle it yourself.
Need Help with your Homework or Essays?
Can an Essay have Charts?
Using charts and graphs in an essay is good and can improve the grades by backing up your arguments in an essay. However, it is good to know when to use them and when not to.

Charts can be used in an essay if it is long enough to accommodate them or the instructions allow you to insert them.
You can use charts and graphs in a paper long as they add meaning to your arguments in a reasonable way.
They should fit in well with the essay’s context and should not be viewed as just decoration.
Charts should clearly explain the ideas you present and make it easy for readers to understand the ideas. Charts help you demonstrate facts, information, and figures that you obtain from research.
With that said, some institutions do not allow for the use of charts in essays. These institutions view an essay as a free-flowing piece of writing that should be continuous.
This also leaves no chance for the use of bullets and arrows in essays. Using charts in your essays in such institutions may prove costly to your grades or make your essays be looked down upon.
How to Effectively Insert Charts and Graphs in an Essay?
If a chart you create fits in effectively with the context you are explaining in your essay, then inserting the chart in your essay should not be a problem.
Graphs and charts should be large enough for clear visibility. As you insert a research paper graph in a paper, be sure to have them drawn or data analyzed. The following should be included when inserting a chart in your essay.
1. Label the Chart
Always include a caption under your chart. The caption should be clear. It can contain the topic of the chart or just a description.
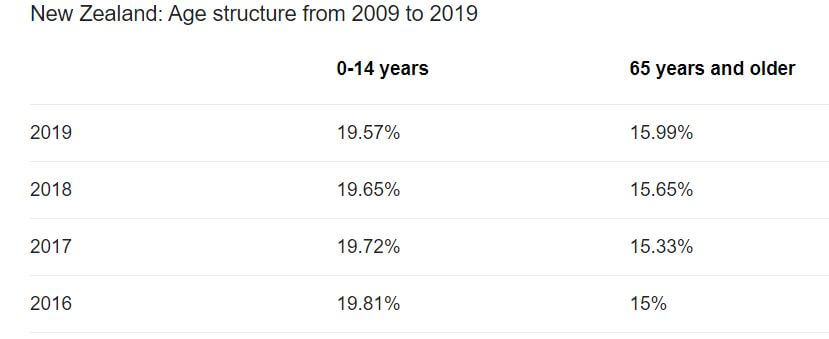
This caption helps a reader relate the surrounding texts to the information included in the charts. For example, (‘Figure 2’ Age Distribution in New Zeeland.)
2. Mention the Chart in the Text
Reference the chart before introducing an essay. This helps the reader have a clue about what the chart will be all about.
If your chart illustrates a point in your essay you can include the following line before introducing your chart. ‘Figure 2 below shows an example of this.’ Here is an example.
3. Cite Charts Obtained from Different Sources
Just as you quote someone in an essay, you need to cite charts found from other sources to avoid plagiarism.
How you cite usually varies depending on the referencing format you are using. When using the author-date referencing format, always include the name of the author of the source and the year of publication.
Other referencing formats also may require you to include the page that the chart was obtained from. The source should not only appear on the chart but also the reference list of the whole essay.
The style of writing you use in your essay also determines the type of referencing format you use. APA references are different from MLA references and Chicago format references.
4. Using Meaningful Titles
A title you give your graph or chart should represent what your graph or chart is all about. The title should be simple to make the reader understand straightaway the information that will be represented on the graph.
Graph titles are always located above the graphs while the titles of charts and figures are located below the charts.
It is also important to look at some of the things you should not do when inserting charts and graphs in your paper:
- Never restructure data from another source to fit in your chat or graph without acknowledging the source. Data from tables and figures should not be directly transferred to charts and graphs.
- Never use charts and figures in your essay without referring to its existence in your essay or without it making relevance in your arguments in the essay.
- Point out significance in your charts and graphs without using extensive explanations and descriptions in the contents of the charts.
Get a Brilliant Essay today!
Let our essay writing experts help you get that A in your next essay. Place your order today, and you will enjoy the benefits.
Importance of Charts and Diagrams in an Essay or Paper
Charts and diagrams are used to communicate information. Symbols, signs, and pie charts are some examples of diagrams that are used to convey particular information.
Charts and diagrams provide a better way for people to relate to the information and process its importance. The following are some of the benefits of using charts and diagrams in a paper:
1. Visualizing Concepts
Instructors can see and conceptualize with materials represented in the form of charts and diagrams in essays. The instructors can engage with the material more even without much more explanation from the essay.
Different types of diagrams have different ways of representing information. This varies on different topics. For example, Venn diagrams place words that are interrelated in bubbles to represent the interrelation of concepts.
Using charts and diagrams, therefore, makes complicated topics easily understandable. This makes it easier for the essay writer to represent information in a way easily understandable by the instructor.
2. Diagrams and Charts say more
Explaining concepts such as statistical data and information concerning the performance of system functions is easily done through diagrams and charts.
Explaining concepts also is quicker and avoids the strain and the use of resources. Using diagrams and charts is without a doubt more effective in an essay than not.
For example, medical students can explain the functioning of different organs of the human body, such as the heart, the kidney, and the digestive system using pictures, charts, and diagrams of the organs.
The use of diagrams is also crucial in business-based essays, where information dissemination needs comprehension, speed, and accuracy of information.
3. Diagrams and charts catch and maintain attention
Attention is usually important among readers. Attention can determine whether the information you are presenting is accepted and absorbed by readers or if they will turn it down.
Diagrams and charts maintain your readers’ attention by giving them something they can look at and engage with. This allows for the easy absorption of information in understandable and memorable bits.
Students can use diagrams to make instructors understand their research easily. This is by using a diagram to break down the research plan into simple, understandable concepts.
4. Charts and Diagrams are Effective for Comparison Essays
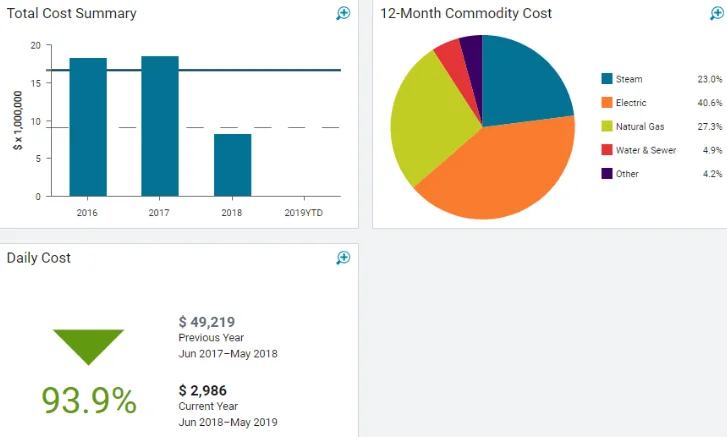
Analysis of data can be done effectively using charts and graphs. Pie charts represent different quantities of data, while graphs can plot variables on the x and y planes for comparisons. There can’t be a better way of analyzing data than this.
FAQs on Essays having Charts
Can an Essay have Pictures?
An essay can have pictures because they can help drive a point home in your essay. Pictures are indeed worth a thousand words and they may be what you need. However, some institutions are against it. Therefore, it is important to inquire before using pictures in your essay.
Pictures in essays should serve a rhetorical purpose, not as a way of padding your essay. How you use a paper in your essay should be per the writing format you used.

This further helps to make your arguments more convincing. Pictures should be placed where they make the most sense in your essay.
In MLA style documents pictures should be inside your I-inch margins and should contain reference in the caption crediting the source.
The caption should be referred to in the body of your essay to give the reader an insight into what it will be all about.
In APA style if the picture spans one column it should be between 2-3.25 inches.
If it takes two columns, it should be 4.25 inches to 6.875 inches. Captions in this style should use the sans-serif font and be between 8-12 font sizes.
Can an essay have Tables
One can use tables in an essay and in some courses, it is highly encouraged. However, the use of tables on essays depends on the style requirement of the place the easy will be published or submitted to. No rule prohibits the use of tables in an essay.
This leaves the institution with the discretion to decide the use of tables in essays. Institutions that prohibit the use of tables in essays believe that they are a form of expanding a page count without writing many actual words.
Such institutions believe that essays should consist of words only, therefore, prohibiting graphs, pictures, and other diagrams.
Many publishers and some institutions are not against the use of tables in essays. They view tables as a good method that can be used to represent and explain information better.
Can an essay have Graphs
Graphs can be used appropriately in essays to represent dense information in paragraphs. These paragraphs may prove hard to understand but graphs help break them down into an easily understandable diagram.
With graphs references of figures made later in the essay are easily identifiable. Without graphs, the reader will have to search for a particular line in the easy to refer to.
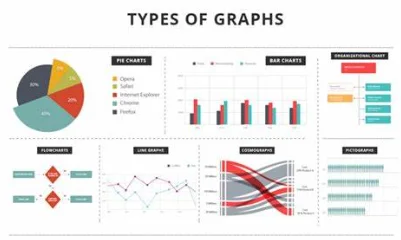
When you have a lot of numbers to share with readers, graphs are the perfect representation format. The most used types of graphs are; line graphs, bar graphs, and pie charts.

With over 10 years in academia and academic assistance, Alicia Smart is the epitome of excellence in the writing industry. She is our managing editor and is in charge of the writing operations at Grade Bees.