Text Features: Definition, Examples, and How to Use Them
Text figures are probably the most ignored parts of books or any piece of writing. You will find that immediately you grab a book you skip to the main content.
Text features are parts we see in books, journals, and research papers every time and pay little attention to. This happens in the modern world we are living in today.

However, a few centuries ago text features would be appreciated more.
Also Read: How to Email a Professor: Etiquettes for Help, Research, or Grades
What are Text Features?
Text features are parts of books or other writings that are not considered part of the main text. They are mostly associated with non-fictional texts and articles.
The purpose of many text features is to help locate and navigate to specific information provided in writing. Therefore, they make reading academic materials easier.
It is important to understand how to use text features because they help readers to effectively interact with any written material. Text features are also combined with normal texts to present information on any material in a structured and organized format.
Examples of Text Features
The most common types of text features include tables of content, diagrams, charts, graphs, photographs, illustrations, headings, indexes, captions, and glossaries.
They are not only found in books and articles but also in magazines, newspapers, research papers, and journals.
Types of Text Features and How Each is Used
Some of the most commonly used text features include:
1. Charts
Charts usually combine texts, graphics, and symbols to represent the relationships between multiple sets of data. They are one of the most popular methods of sharing information in different pieces of writing.
Through them, writers have an easy way to ensure that readers easily compare multiple sets of data. Charts are also used to enable people to understand and remember information better.
Writers can additionally make the information they are putting across more convincing through charts.
Charts are also valuable when you need to show the relation between two sets of data that you want readers to retain.
The relationship can include comparing different values, understanding how differences impact the whole, and analyzing trends of data that veer away from what you are used to.
2. Graphs
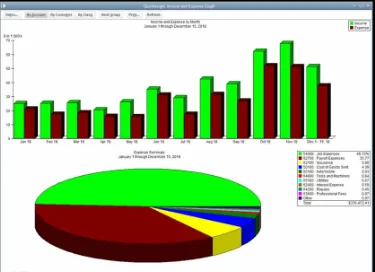
Graphs present a basic way of illustrating the relationship between data visually. Data that is too complicated to be represented in text form is easily presented in graphs. Data can be presented in graphs such as line graphs, bar graphs, and pie charts.
Graphs are also used to reveal comparisons and trends. Differences between sets of data are presented in graphs and trends are easily noticeable.
Graphs are commonly used by print media as effective visual tools to present information easily and quickly.
Additionally, graphs show the relationship between variables and the value spread of a given phenomenon.
Anything that involves geometry can be easily represented in graphs because they can be made up using lines, dots, and blocks. Graphs are the most used text features that visualize data.
3. Glossary
This is also known as the personal dictionary of a book, article, or research paper. It is usually found on the back of the book or the last pages of a research project or article.
Glossaries present a perfect way to list, define, and expand upon intricate, made-up, or foreign words that have been used in any piece of writing. The words are usually written in alphabetical order with their definitions next to them.
When words, abbreviations, or phrases are used in writing related to a specific area or discipline, the use of glossaries is the most appropriate way of providing the meanings. The pronunciation of the new words can also be provided next to them.
If a word has several meanings, they should all be included in the glossary to help readers apply their context.
4. Pictures
Pictures in books are visuals that try to replicate what is being talked about. They provide clues to help the reader discover more about a narrative. Through pictures, details of character development that are more complex are analyzed.
Pictures show expressions, context, and unwritten details that help the reader compare and contrast. Through pictures, the message that the writer wants to convey is put across easily without the reader having to go through the entire text.
Sometimes pictures are better at communicating stories than written words especially when they show emotion. Also, they are instrumental in grabbing attention better hence attracting more readers.
Also Read: Professor not Grading Assignments on time? Here’s what to do
5. Table of Content
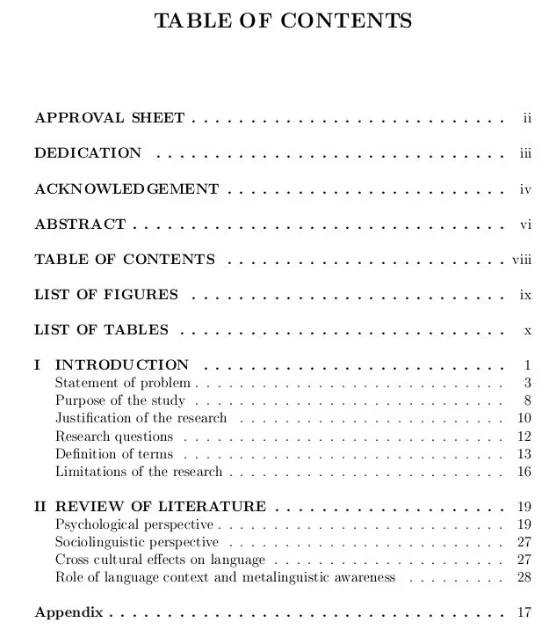
A table of contents is a list at the beginning of most written materials that outlines chapters and their respective sub-sections accompanied by their corresponding page numbers.
This page usually comes after the title page and acknowledgment of a book or research paper but before the introduction.
Its position is not debatable. It is universal for all academic projects to have a table of contents page on the first pages.
The table of contents enables the reader to know everything that is included in a book and is therefore crucial in managing expectations.
Also, one can easily locate a book that has the content they are looking for through it.
A table of contents page format includes a title at the very top, chapters, and sub-titles in chronological order with page numbers at the end of the line.
6. Captions
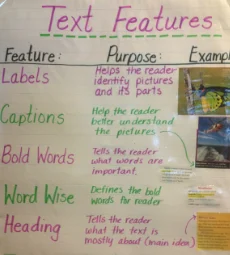
Captions are the words that are beneath a graph, photographs, and charts used to explain what they are. They give more meaning to pictures and help enrich the understanding that has already been gained through the text provided.
Also, captions can help the reader understand information that may not even be included in the text but relates to it.
When captions are paired with interesting photographs, they spark interest among the readers to read the full text and story.
When you include other text features such as photos, graphs, and charts in your writing and refuse to add captions below them, then the readers are likely to make their own conclusions about those features.
7. Bolding
This is the highlighting of words and phrases to make them stand out in a text. Bolding texts show emphasis on words and phrases.
When you have used another format such as italics and still feel that you have not achieved the emphasis you want then that is the appropriate time to bold text.
Mostly in writing, bolding is used when writing titles to enable the reader to differentiate parts of the writing. This helps avoid confusion and enhances understanding.
Also, bolding is used in titles of tables, charts, and graphs for easy identification.
Bolded texts help grab the attention of the reader. This feature should be used sparingly because if you emphasize everything in a text the readers will experience difficulties taking note of the exact emphasis.
8. Labelled Diagrams
Diagrams in your writing can include tables, graphs, and charts. They should all be properly labeled to help the reader understand them well and avoid referencing the wrong ones especially when similar diagrams are used severally.
The writer should always refer to how a diagram is labeled when they want readers to look at it for reference.
Diagrams in any piece of writing have different labeling ways. For example, the x-axis and the y-axis in graphs should be well labeled. Labeling diagrams help readers identify parts of a diagram and apply their concept of understanding.
The relationship between different parts of a diagram can also be well understood through labeling. When labeling diagrams one should ensure the accuracy and clarity of figures.
9. Index
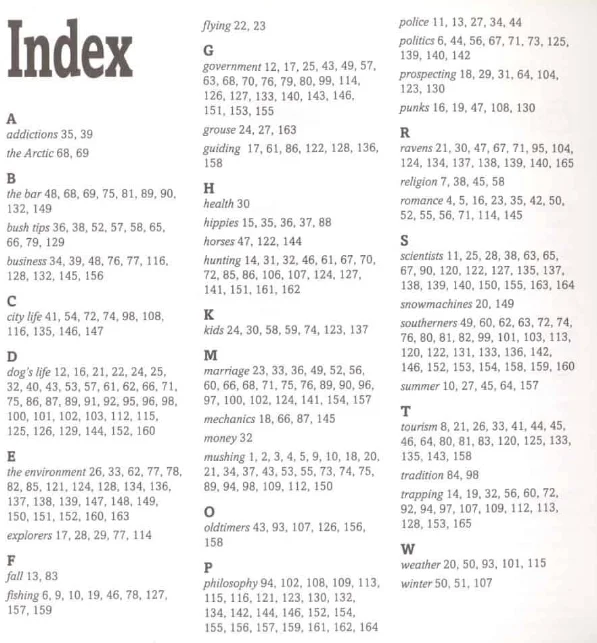
The index is a list that consists of all ideas, names, and subjects of written work to help readers easily find where they are located in the text. The purpose of an index is not only to list the content but also to analyze it. It is found at the end of the text.
Indexes are not only found at the back of books but also in reports, atlases, art collections, maps, and online databases to make navigation to specific words and phrases easy.
In online publications clicking the index directs you straight to the text. Indexes should be arranged alphabetically and should not include all words and phrases in the text.
Also Read: How to Cheat on a Math Test: 9 Tricks and Hacks
10. Headings
Headings are a few words at the beginning of texts that help us understand what they are all about. They are used to help the reader identify the main idea of a section or text.
The reader can tell what they are about to read. Also, they can make connections on what they know about that topic before reading it to make sure they make connections and supplement their understanding.
Readers are also able to easily locate specific content that they want to read in any text that has headings.
In long texts, headings help in organizing and presenting ideas in the paper and ensuring that the reader flows with the content written. If the readers read the heading of your paper only, they should be able to preview everything that your paper covers. This includes the main ideas and arguments.
Headings can be long provided they clearly communicate the content of the sections but should mostly not exceed a line.

With over 10 years in academia and academic assistance, Alicia Smart is the epitome of excellence in the writing industry. She is our chief editor and in charge of the writing department at Grade Bees.